Planck CMB map at high resolution

python
astrophysics
healpy
Published

September 10, 2013

Prompted by a colleague, I created a high-resolution version of the Cosmic Microwave Background map in MollWeide projection released by the Planck collaboration, available on the Planck Data Release Website in FITS format.

The map is a PNG at a resolution of 17469x8796 pixels, which is suitable for printing at 300dpi up to 60x40 inch, or 150x100 cm, file size is about 150MB.

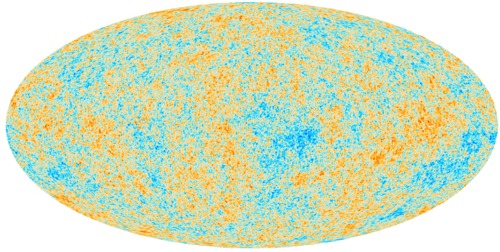
Update: now with Planck color scale

Update: previous version had grayed out pixels in the galactic plane represents the fraction of the sky that is not possible to reconstruct due to bright galactic sources. The last version uses inpainting to create a constrained CMB realization with the same statistics as the observed CMB to fill the unobserved pixels, more details in the Planck Explanatory Supplement.

Preview of Planck CMB map
# Script by Andrea Zonca, http://zonca.github.io
import matplotlib
matplotlib.use("agg")
import healpy as hp
import matplotlib.pyplot as plt
use_planck_cmap = True
# Colormap available from https://github.com/zonca/paperplots/raw/master/data/Planck_Parchment_RGB.txt
# Maps available at: http://irsa.ipac.caltech.edu/data/Planck/release_1/all-sky-maps/
input_filename = "COM_CompMap_CMB-smica_2048_R1.20.fits"
m=hp.read_map(input_filename, ("INP_CMB",))
cmap = None
out_filename = input_filename.split(".")[0]
if use_planck_cmap:
############### CMB colormap
from matplotlib.colors import ListedColormap
import numpy as np
colombi1_cmap = ListedColormap(np.loadtxt("Planck_Parchment_RGB.txt")/255.)
colombi1_cmap.set_bad("gray") # color of missing pixels
colombi1_cmap.set_under("white") # color of background, necessary if you want to use
# this colormap directly with hp.mollview(m, cmap=colombi1_cmap)
cmap = colombi1_cmap
out_filename += "_planck_cmap"
dpi = 300
figsize_inch = 60, 40
fig = plt.figure(figsize=figsize_inch, dpi=dpi)
print "Mollview"
# removed the colorbar, the map range is -500 / +500 microK
hp.mollview(m, fig=fig.number, xsize=figsize_inch[0]*dpi, min=-500, max=500, title="", cbar=False, cmap=cmap)
print "Save"
plt.savefig(out_filename + ".png", dpi=dpi, bbox_inches="tight")