This is an update of my older tutorial
Unfortunately I was not able to make Mayavi properly plot the data, rerunning the same code would give a map that looked like uniform noise.
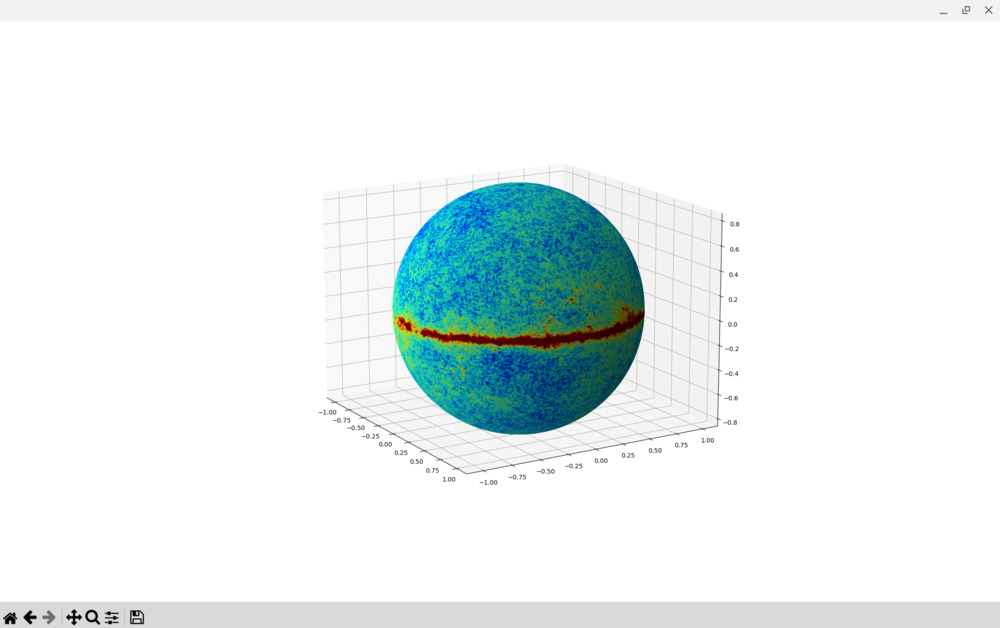
This test instead uses matplotlib, unfortunately this is extremely slow, and the output map is really slow to rotate or interact at all. Anyway it is possible to tweak xsize,ysize to change the resolution as a trade-off between resolution and interactivity.